
I’m trying to build a convenient dashboard to visualize job posting data on various websites. The goal is to construct a pipeline that will collect data from the web on a timely basis and export it in a useful form to some database, where it can be analyzed at a later time. This would be a typical ETL process except… I’m not using my own data.
I’ve some experience building Airflow DAGs but not much in building the entire pipeline, so this is all new to me. I figure a good lightweight and financially affordable option would be to use AWS Lambdas. I can deploy a bunch of spiders in the cloud (picture that), have them harvest data on a timely basis and export the raw data to an S3 bucket, and let the Lambdas do the rest.
Architecture
The architecture of the project looks something like the following. In the extract step, we deploy a bunch of automated spiders on ScrapingHub to crawl and export data on a timely basis to an S3 bucket. In the transform step, we use a Lambda function that is triggered when new data enters the S3 bucket to process the raw data into a form that is usable for downstream analysis. Finally, in the load step, we load the data into a MySQL database, in this case an AWS RDS server. My data size and personal budget do not currently allow for anything fancier than that.
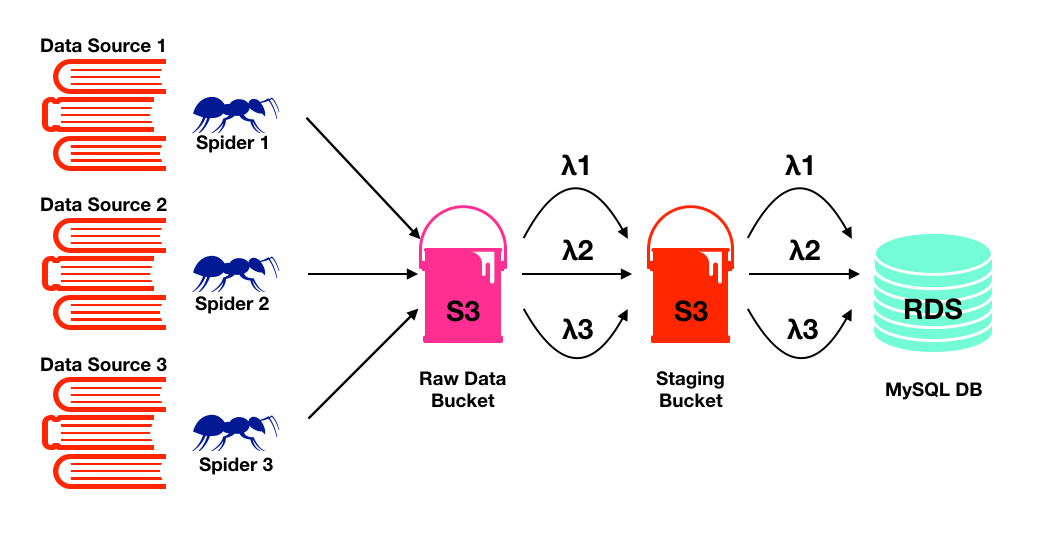
Proposed architecture of this pipeline. Spiders have been replaced with ants to improve the appealing-ness of this diagram.
The Lambda
There are plenty of templates and examples of Lambda functions online. The following is a template I’ve adapted from my own deployment with most of the unnecessary bits removed.
Isolating dependencies from logic
It’s good to isolate the Lambda function from its dependencies. This helps to keep the Lambda short and clean. The dependencies can be conveniently packaged into a Layer which can then be attached to the Lambda function. The structure of the Layer should be as follows.
layer.zip
    |-python
        |-dependency1
        |-dependency2
        |-dependency3
In this case, my main dependencies are the connectors to the various database that I am using, as well as my own library of functions for processing the raw data harvested from various sources. I cannot confirm or deny if the dist-info folder was necessary. My Layer looks as follows.
layer.zip
    |-python
        |-pymysql
        |-PyMySQL-0.9.3.dist-info
        |-(my custom library)
Then, you can simply add the Layer to the Lambda. Just note that if you are updating your Layer to a new version, you will have to tell the Lambda to use the new version. This prevents your working Lambda from breaking due to bad untested new Layers.
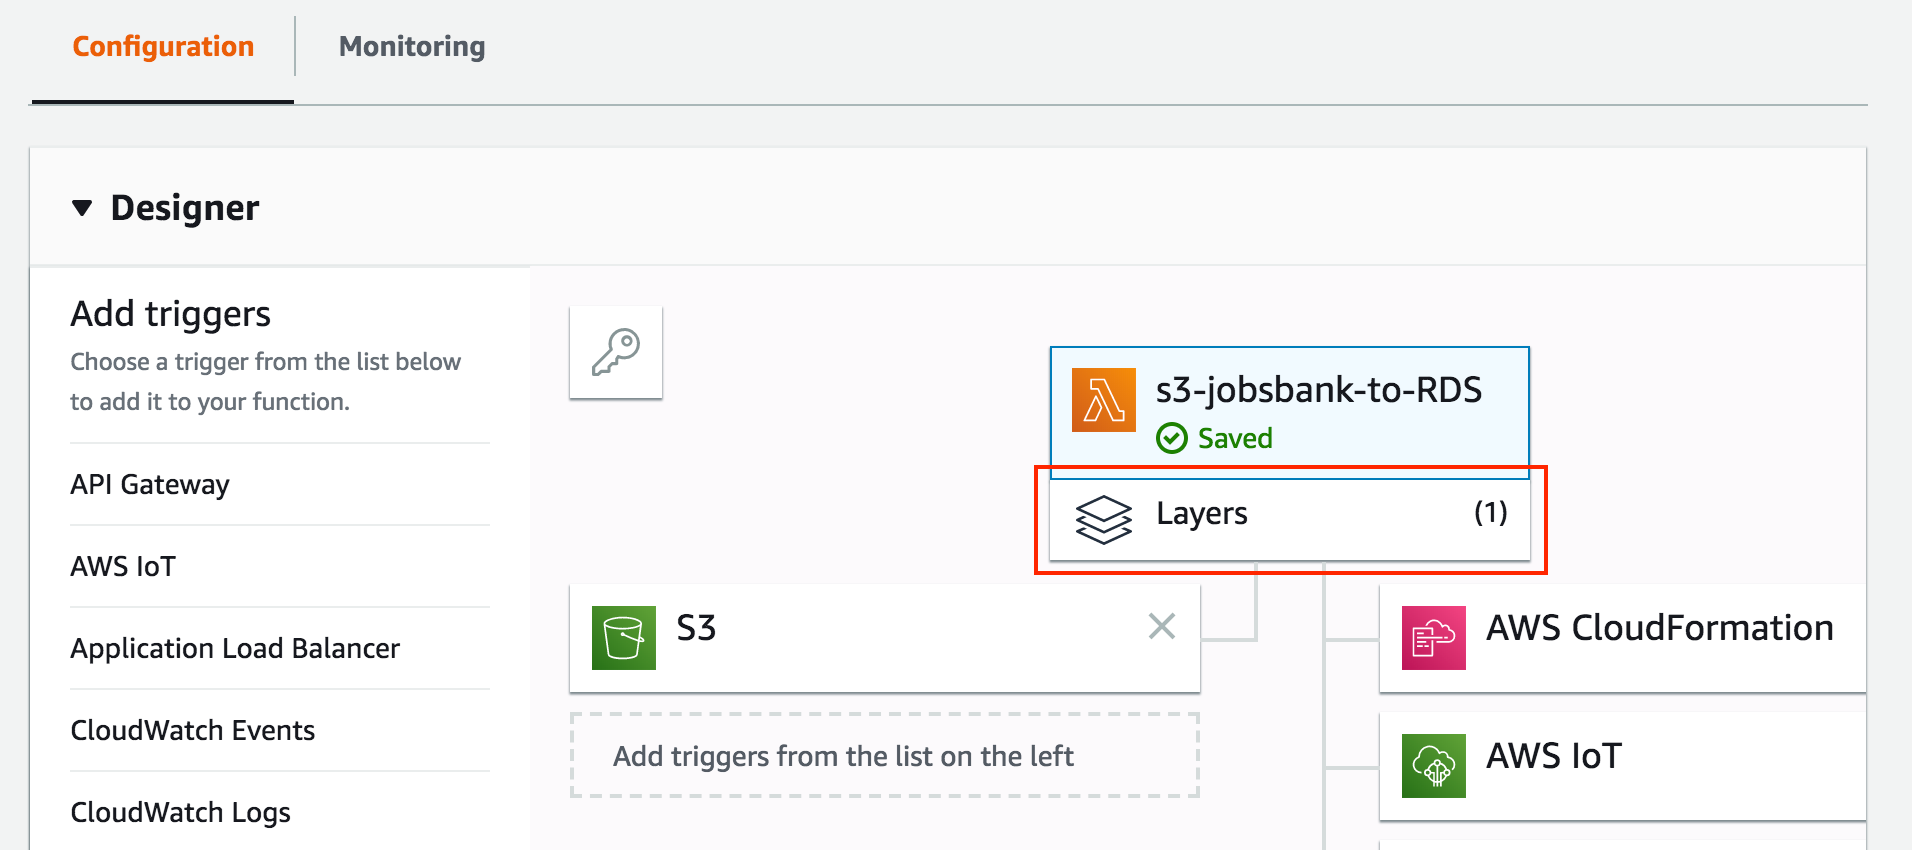
Select the layer option, and add the layer you have uploaded.
You can vary the amount of memory you wish to provide to the Lambda function. The amount of processing power your Lambda has access to scales (linearly?) with the amount of memory being provided to the Lambda. You’re billed for the product of the memory and running time, so find something that works. For myself, each raw daily dataset from a single source is about 600MB in size on average, and it takes about 22 seconds to download, process and upload (total time for the transform and load step) at 1.5GB of memory.
VPC Security Issues
Deploying all this stuff requires some minor security configuration tweaks, things I wished someone had summarized and documented somewhere for this simple task. The boto3 connector fails silently when it is unable to access files on S3 due to access controls, leading me to wonder for a while if my compute needs were beyond what Lambda could provide affordably. For a simple working configuration that I suppose is moderately secure, the Lambda function needs to be in the Virtual Private Cloud (VPC) of the resources it needs to access. In this case, I put my S3 bucket, my Lambda function, and my RDS MySQL server in the same VPC. The S3 bucket should also be in the same geographic region as the Lambda.
A second important step is to change the Security Group settings to allow access to the resources from itself. By default, members of a Security Group do not trust other members in the same Security Group.
Finally, the last step is to allow incoming connections to the RDS server from the Security Group.
Bulk Loading Data
Each data source requires me to load about 20 thousand rows daily each. It still fits in one machine, so it’s not Big Data obviously, but I wasn’t sure if AWS charges by the database transaction. In any case, it would be more efficient to use a bulk insert as opposed to 20 thousand separate inserts. This is made convenient by the LOAD DATA INFILE command. Since we’re working with relational databases with a well-defined schema, the Lambda can transform our raw data into a form that conforms to the schema (has the same headers), where it can simply be loaded into the database. My full SQL command is documented here, assuming the input file is a CSV file.
The first line is ignored because it contains the headers and not data. An annoying thing to deal with in a CSV file is the presence of extra commas in text fields. We can fix this by adding an option that indicates that fields are enclosed by quotations. This of course, only works if your fields are actually enclosed by quotations in the transform step of the Lambda. Using Python’s default csv library, we can set both the quoting and the line terminator, just for consistency. A sample gist for writing the output to a CSV file is shown below.
Conclusion
I’ve managed to automate a pipeline for data harvesting and processing. It’s also fairly modular - we can add new data sources by simply deploying extra spiders and extra Lambdas for each data source independently of preexisting ones. Should spiders break due to site changes, we can swap out broken spiders for new ones without touching the rest of the pipeline as well. In future, we can then take this processed and exported data and wrap a visualization tool around it for great fun and joy.